Dollar Cost Averaging Calculator
Build wealth steadily with consistent investments over time. Calculate your portfolio growth, compare strategies, and visualize the power of compound returns.
Results are for illustrative purposes only.
| Year | Contributions | Investment Growth | Portfolio Value | Cumulative Return (%) |
|---|
Related Finance Calculators
Calculate returns on a one-time investment
Calculate crypto investment gains and losses
Compound Annual Growth Rate calculator
Annual Percentage Yield calculator
Track and project portfolio performance
Plan to reach your financial goals
How to Use This Calculator
Using our DCA Calculator is simple. Here is a quick guide to help you set up your investment plan and analyze the results effectively.
1 Configure Your Strategy
Start by entering your financial details in the input panel. You can customize the currency, set an initial investment, and define your recurring investment amount and frequency (e.g., monthly). Finally, set your expected annual return and the investment period in years and months. You can even toggle optional settings for inflation or annual contribution increases.
2 Analyze Your Results
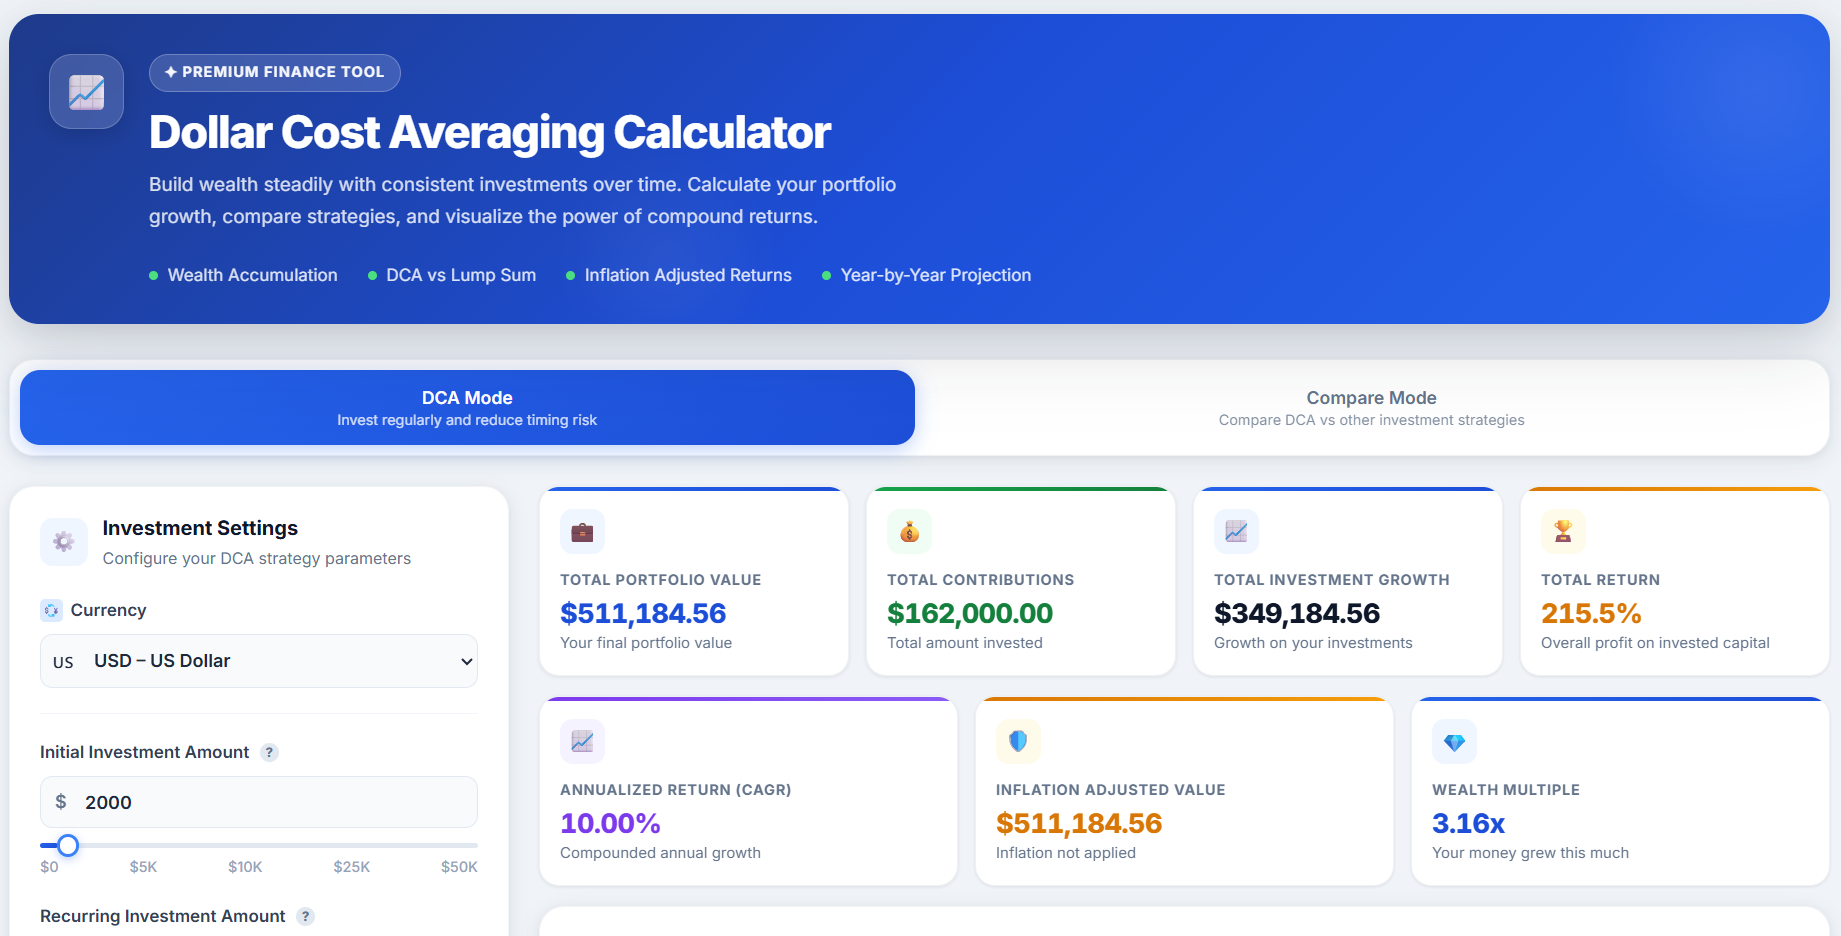
After clicking Calculate DCA, the results panel will display a comprehensive breakdown of your wealth accumulation. The result cards provide key metrics about your investment:
- Total Portfolio Value: The estimated final balance of all your investments combined.
- Total Contributions: The exact total amount of money you invested out of pocket.
- Total Investment Growth: The amount of money you earned purely from market returns.
- Total Return & CAGR: The overall percentage profit and your compounded annual growth rate.
- Inflation Adjusted Value: Your portfolio's real purchasing power in today's money (if inflation is enabled).
- Wealth Multiple: A metric showing exactly how many times your original money multiplied.
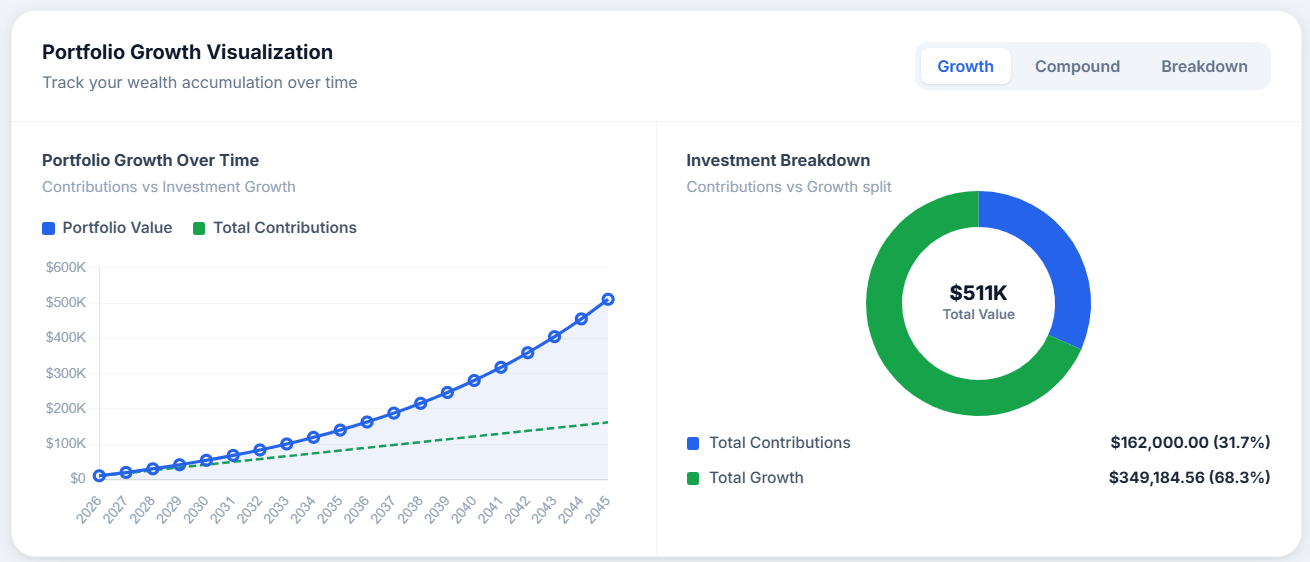
You can also explore the interactive charts to visualize your contributions versus investment growth over time, switch between Growth, Compound, and Breakdown views, or scroll down to see a detailed year-by-year table and strategy comparisons.
What is Dollar Cost Averaging (DCA)?
Dollar Cost Averaging (DCA) is an investment strategy where you invest a fixed amount of money at regular intervals, regardless of market conditions. This disciplined approach removes the emotional pressure of trying to "time the market" and helps build wealth steadily over time.
When asset prices fall, your fixed investment buys more units. When prices rise, you buy fewer units. Over time, this averaging effect can lower your cost basis and reduce the impact of short-term market volatility on your long-term returns.
How DCA Works
- Regular Intervals: Invest a fixed amount daily, weekly, monthly, or quarterly regardless of price.
- Automatic Averaging: Buy more shares when prices are low, fewer when prices are high.
- Compound Growth: Reinvested returns generate their own returns, accelerating wealth building.
- Reduced Anxiety: Remove the stress of market timing from your investment decisions.
DCA vs. Lump Sum Investing
In a consistently rising market, lump sum investing tends to outperform DCA because your full capital grows for longer. However, DCA typically outperforms when markets are volatile or declining, since you purchase more units at lower prices. For most retail investors, the behavioral benefits of DCA—consistency, discipline, and reduced anxiety—often outweigh any performance difference.
Best Practices for DCA
- Choose a realistic contribution amount you can sustain without stress.
- Automate your investments to remove human emotion from the equation.
- Diversify across asset classes to spread risk further.
- Reinvest all dividends and returns to maximize compounding.
- Review your strategy annually and increase contributions as your income grows.