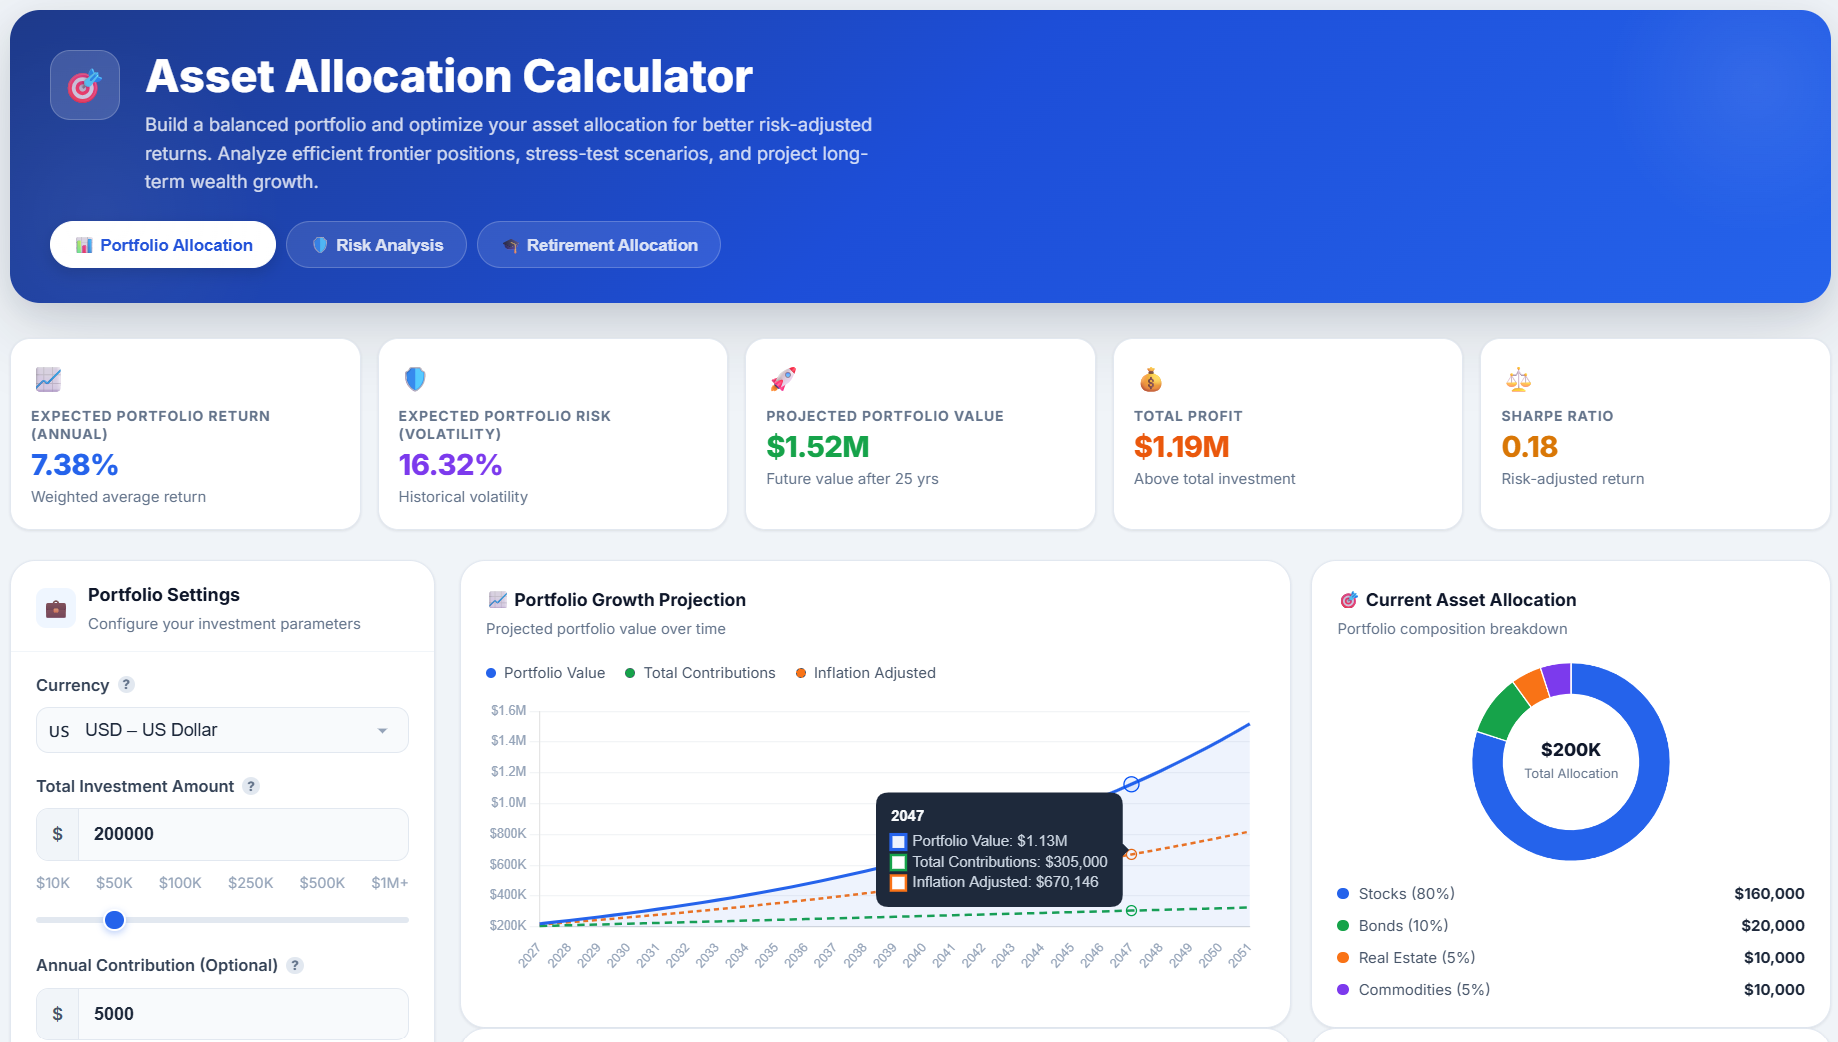
Asset Allocation Calculator
Build a balanced portfolio and optimize your asset allocation for better risk-adjusted returns. Analyze efficient frontier positions, stress-test scenarios, and project long-term wealth growth.
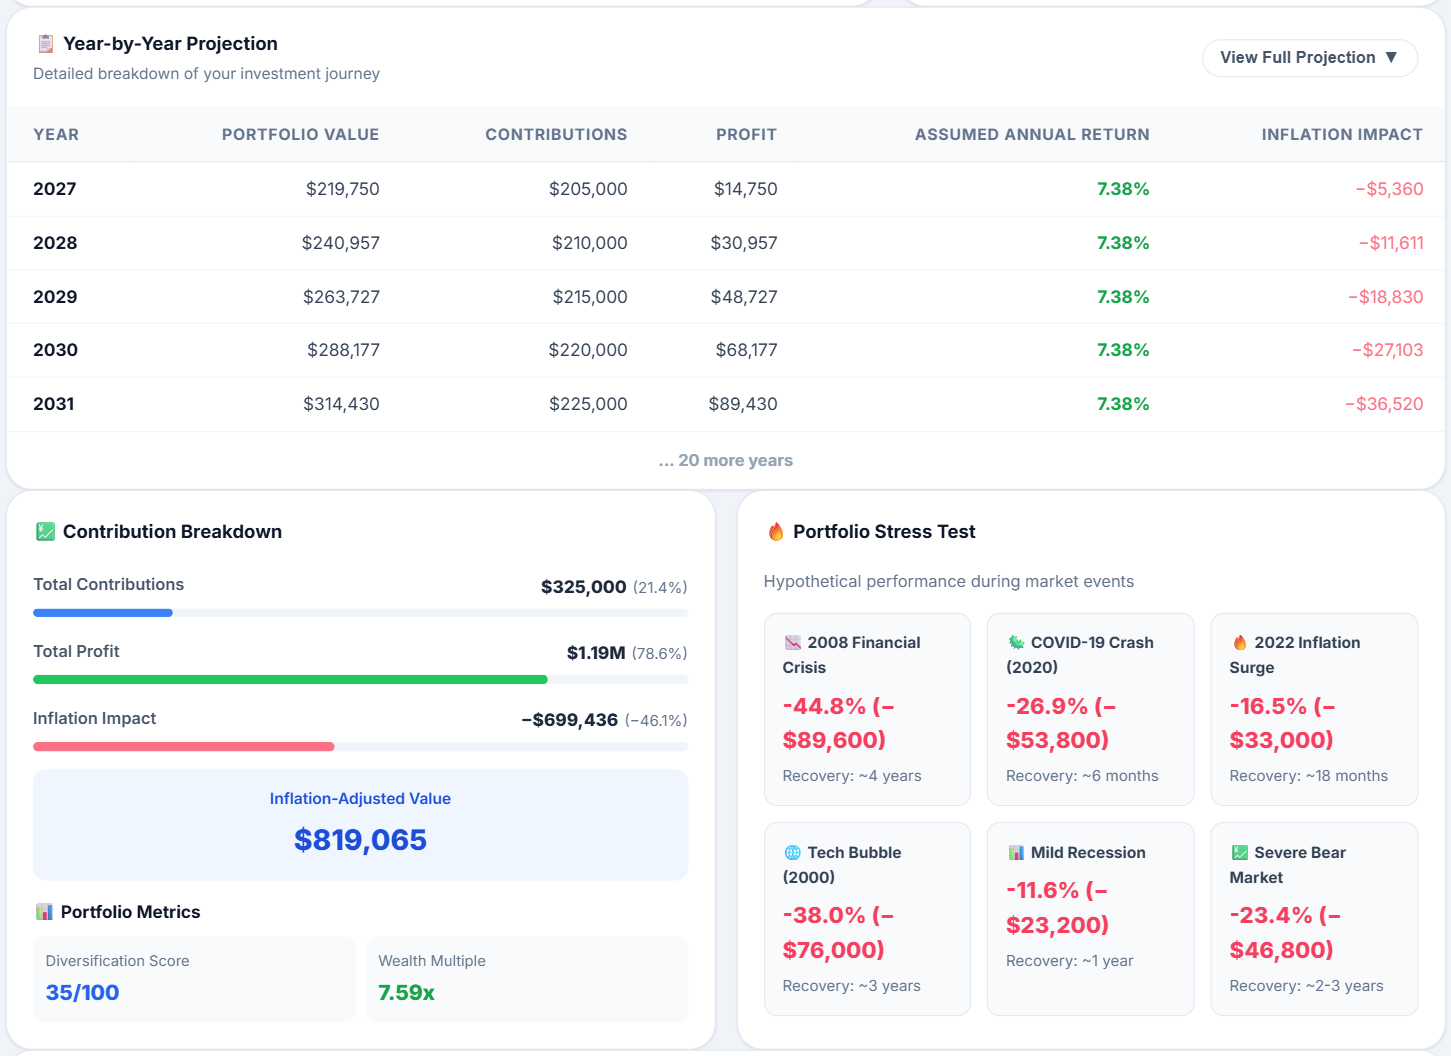
| Year | Portfolio Value | Contributions | Profit | Assumed Annual Return | Inflation Impact |
|---|
Related Finance Calculators
Calculate returns on a one-time investment
Calculate crypto investment gains and losses
Compound Annual Growth Rate calculator
Annual Percentage Yield calculator
Track and project portfolio performance
Analyze Dollar Cost Averaging strategies
How to Use This Calculator
Using our Asset Allocation Calculator is simple. Here is a quick guide to help you build your ideal portfolio and analyze its risk-adjusted returns effectively.
1 Configure Your Strategy
Start by entering your financial details in the input panel. You can customize the currency, set a total investment amount, and define any annual contribution. Select your investment time horizon and risk tolerance (from Conservative to Very Aggressive) to tailor the projections. Below that, set your target allocation percentages for various asset classes like US Stocks, Bonds, and Real Estate.
2 Analyze Your Results
After clicking Calculate Allocation, the results panel will display a comprehensive breakdown of your portfolio's performance. The result cards provide key metrics and stress-test data about your investment:
- Total Contributions & Profit: Detailed metrics showing your total out-of-pocket investments versus pure market profit.
- Inflation Impact & Adjusted Value: The estimated reduction in purchasing power and your portfolio's real value in today's money.
- Diversification Score: A rating indicating how well your portfolio is spread across uncorrelated asset classes.
- Wealth Multiple: A metric showing exactly how many times your original money multiplied.
- Portfolio Stress Test: A breakdown of how your portfolio might perform during major market events (e.g., 2008 Crash, Tech Bubble).
You can also explore the interactive charts to visualize your portfolio growth over time, asset allocation distribution, risk vs. return on the efficient frontier, and strategy comparisons.
What Is Asset Allocation?
Asset allocation is the strategic process of dividing your investment portfolio among different asset categories — such as stocks, bonds, real estate, commodities, and cash. The goal is to balance risk and reward according to your specific objectives, risk tolerance, and investment time horizon.
Unlike stock picking or market timing, asset allocation is a structural decision that determines the overall character and risk profile of your portfolio. Research consistently shows that asset allocation is responsible for the vast majority (often cited as 90%+) of long-term investment performance variability.
Key Insight: Studies by Brinson, Hood, and Beebower (1986, 1991) found that asset allocation accounts for approximately 91.5% of the variation in portfolio returns over time — far more than individual security selection or market timing.
The Three Pillars of Asset Allocation
- Strategic Allocation: Your long-term target mix based on goals and risk tolerance, set and held constant regardless of market conditions.
- Tactical Allocation: Short-term deviations from your strategic target to capitalize on perceived market opportunities or risks.
- Dynamic Allocation: Continuous adjustments based on changing market conditions, typically using quantitative signals and momentum models.
Major Asset Classes
- Equities (Stocks): Ownership stakes in companies. Higher return potential with higher volatility.
- Fixed Income (Bonds): Debt instruments providing regular income. Lower risk, stable returns.
- Real Estate: Physical property or REITs. Inflation hedge, income generation, appreciation potential.
- Commodities: Physical goods like gold, oil, agricultural products. Inflation hedge and diversification.
- Cash & Equivalents: Money market, T-bills. Capital preservation and liquidity.
- Alternative Assets: Crypto, private equity, hedge funds. Higher risk/return profiles.
Portfolio Diversification & Modern Portfolio Theory
Modern Portfolio Theory (MPT), developed by Harry Markowitz in 1952, provides the mathematical framework for constructing portfolios that maximize expected return for a given level of risk. The central insight is that diversification — combining assets that don't move perfectly together — can reduce portfolio risk without necessarily reducing expected returns.
The Efficient Frontier
The efficient frontier is the set of optimal portfolios that offer the highest expected return for a given level of risk. Portfolios below the frontier are suboptimal because they don't provide enough return for the risk taken. Portfolios above the frontier are impossible to construct.
Correlation & Diversification Benefits
The key to diversification is correlation — how assets move relative to each other. Assets with low or negative correlation provide the greatest diversification benefit. For example:
- Bonds often rise when stocks fall (negative correlation during crises)
- Gold tends to perform well during inflation and uncertainty
- Real estate provides income and inflation hedging
- International equities diversify geographic and currency risk
The Sharpe Ratio
The Sharpe ratio measures risk-adjusted return — how much excess return you receive per unit of risk taken:
- Below 1.0: Suboptimal risk-adjusted return
- 1.0 – 2.0: Good risk-adjusted performance
- 2.0 – 3.0: Excellent risk-adjusted performance
- Above 3.0: Exceptional (rare, often unsustainable)
The Diversification Score
A higher diversification score indicates better spread across uncorrelated asset classes. Portfolios concentrated in one or two assets score lower, while well-diversified portfolios across multiple asset classes score higher.
Risk Management & Portfolio Stress Testing
No portfolio exists in a vacuum — markets experience periodic crashes, recessions, inflation spikes, and other adverse events. Understanding how your portfolio might perform during these scenarios is crucial for long-term investing success.
Historical Market Crashes
- 2008 Financial Crisis: S&P 500 fell ~57% from peak to trough. A diversified portfolio with bonds and gold fared significantly better.
- 2020 COVID Crash: Markets fell ~34% in 33 days — the fastest bear market ever. Recovery was equally rapid (~6 months).
- 2022 Inflation Surge: Both stocks (-19%) and bonds (-13%) fell simultaneously, challenging traditional diversification.
- 2000 Tech Bubble: NASDAQ fell ~78%. Diversified portfolios with value stocks and bonds were far more resilient.
Risk Management Strategies
- Diversification: The primary risk mitigation tool — spreading investments across asset classes, geographies, and sectors.
- Rebalancing: Periodically restoring your target allocation forces you to "sell high, buy low" systematically.
- Risk Budgeting: Allocating risk (not just capital) to maximize risk-adjusted returns across the portfolio.
- Dollar-Cost Averaging: Investing fixed amounts regularly reduces timing risk and averages your cost basis.
- Emergency Fund: Maintaining 3-6 months of expenses in cash prevents forced selling during downturns.
Rebalancing Strategies & Implementation
Portfolio rebalancing is the process of realigning asset weightings back to your target allocation. Without rebalancing, successful assets grow to dominate the portfolio, increasing risk beyond your intended level.
Rebalancing Methods
- Calendar Rebalancing: Rebalance on a fixed schedule (monthly, quarterly, annually). Simple but may rebalance unnecessarily.
- Threshold/Drift Rebalancing: Rebalance when any asset class deviates by more than X% from target. More responsive to market moves.
- Opportunistic Rebalancing: Combine both — rebalance on calendar, but also when thresholds are breached.
- Cash Flow Rebalancing: Direct new contributions to underweight assets — tax-efficient and avoids selling.
Tax-Efficient Rebalancing
- Rebalance in tax-advantaged accounts (IRA, 401k) first to avoid capital gains taxes
- Use dividends and new contributions to rebalance before selling
- Consider tax-loss harvesting opportunities during rebalancing
- Hold less tax-efficient assets (bonds, REITs) in tax-advantaged accounts
Rebalancing Costs & Frequency
More frequent rebalancing doesn't necessarily improve returns and can increase transaction costs. Research suggests annual or semi-annual rebalancing with a 5% drift threshold often provides a good balance between maintaining target allocations and minimizing costs.
Stocks vs. Bonds: The Core Trade-off
Historical Returns (US Markets, 1926–2023)
- Large-Cap US Stocks: ~10% average annual return, ~20% standard deviation
- Small-Cap US Stocks: ~12% average annual return, ~32% standard deviation
- Long-Term US Bonds: ~5.5% average annual return, ~10% standard deviation
- Short-Term US Bonds: ~3.5% average annual return, ~3% standard deviation
- 60/40 Portfolio: ~8.5% average annual return, ~12% standard deviation
The Rule of 100: A classic guideline suggests holding "100 minus your age" in stocks. Today, with longer lifespans, many advisors use "110 minus age" or "120 minus age" to account for the need for growth in retirement portfolios.
When to Hold More Bonds
- Approaching retirement or needing income within 1-5 years
- Lower risk tolerance — you'd panic and sell during a 30%+ drawdown
- Specific liquidity needs within the investment period
- Already have significant equity exposure through real estate or business ownership
When to Hold More Stocks
- Long investment horizon (10+ years) — time smooths volatility
- High risk tolerance — comfortable holding through major bear markets
- Stable employment income serves as your "bond" in your overall financial picture
- Primary goal is maximum long-term wealth accumulation
Frequently Asked Questions
What is the best asset allocation for retirement?
There's no single "best" allocation for retirement. Common frameworks include target-date funds (which automatically become more conservative as you near retirement), the "100 minus age" rule, and bucket strategies (dividing assets into short-term, medium-term, and long-term buckets). The key factors are your specific retirement date, income needs, Social Security timing, other income sources, and risk tolerance.
How much should I allocate to cryptocurrency?
Most financial advisors suggest keeping crypto to 1-5% of your total portfolio due to its extreme volatility. Some aggressive investors go up to 10-20%, but this significantly increases portfolio risk. Crypto should be considered only if you fully understand the technology and can stomach potential 80%+ drawdowns. Never invest more than you can afford to lose entirely.
What is a good Sharpe ratio for a portfolio?
A Sharpe ratio above 1.0 is generally considered good, meaning you're earning more than 1 unit of return per unit of risk. Ratios above 2.0 are excellent and above 3.0 are exceptional. The S&P 500 has historically had a Sharpe ratio of roughly 0.5-0.8. A well-diversified portfolio often achieves higher Sharpe ratios than individual asset classes due to diversification benefits.
How does inflation affect my portfolio?
Inflation erodes purchasing power over time. A portfolio growing at 7% annually with 3% inflation provides only ~4% real return. Assets that historically protect against inflation include stocks (companies can raise prices), real estate, commodities (especially gold and oil), and Treasury Inflation-Protected Securities (TIPS). Bonds with fixed coupons suffer most in high inflation environments.
What is the difference between ETFs and mutual funds for asset allocation?
Both ETFs and mutual funds provide diversification across many securities. ETFs trade on exchanges like stocks, typically have lower expense ratios, are more tax-efficient, and allow intraday trading. Mutual funds trade once per day at NAV, may have higher fees, but can offer automatic investment and don't require a brokerage account. For long-term asset allocation, low-cost index ETFs are generally preferred for their cost efficiency and tax advantages.